Once your developers have added the NVECTA SDK to your website and apps, and started firing custom events from your tracking plan, the next job is proving that the data actually lands in the panel. This article covers two checks:
- Integration code validation — is the SDK installed and reporting on every platform?
- Event validation — is a specific event firing, with the right name, the right properties, and the right volume?
Where to check your events
Live Stats (real-time, last 30 minutes)
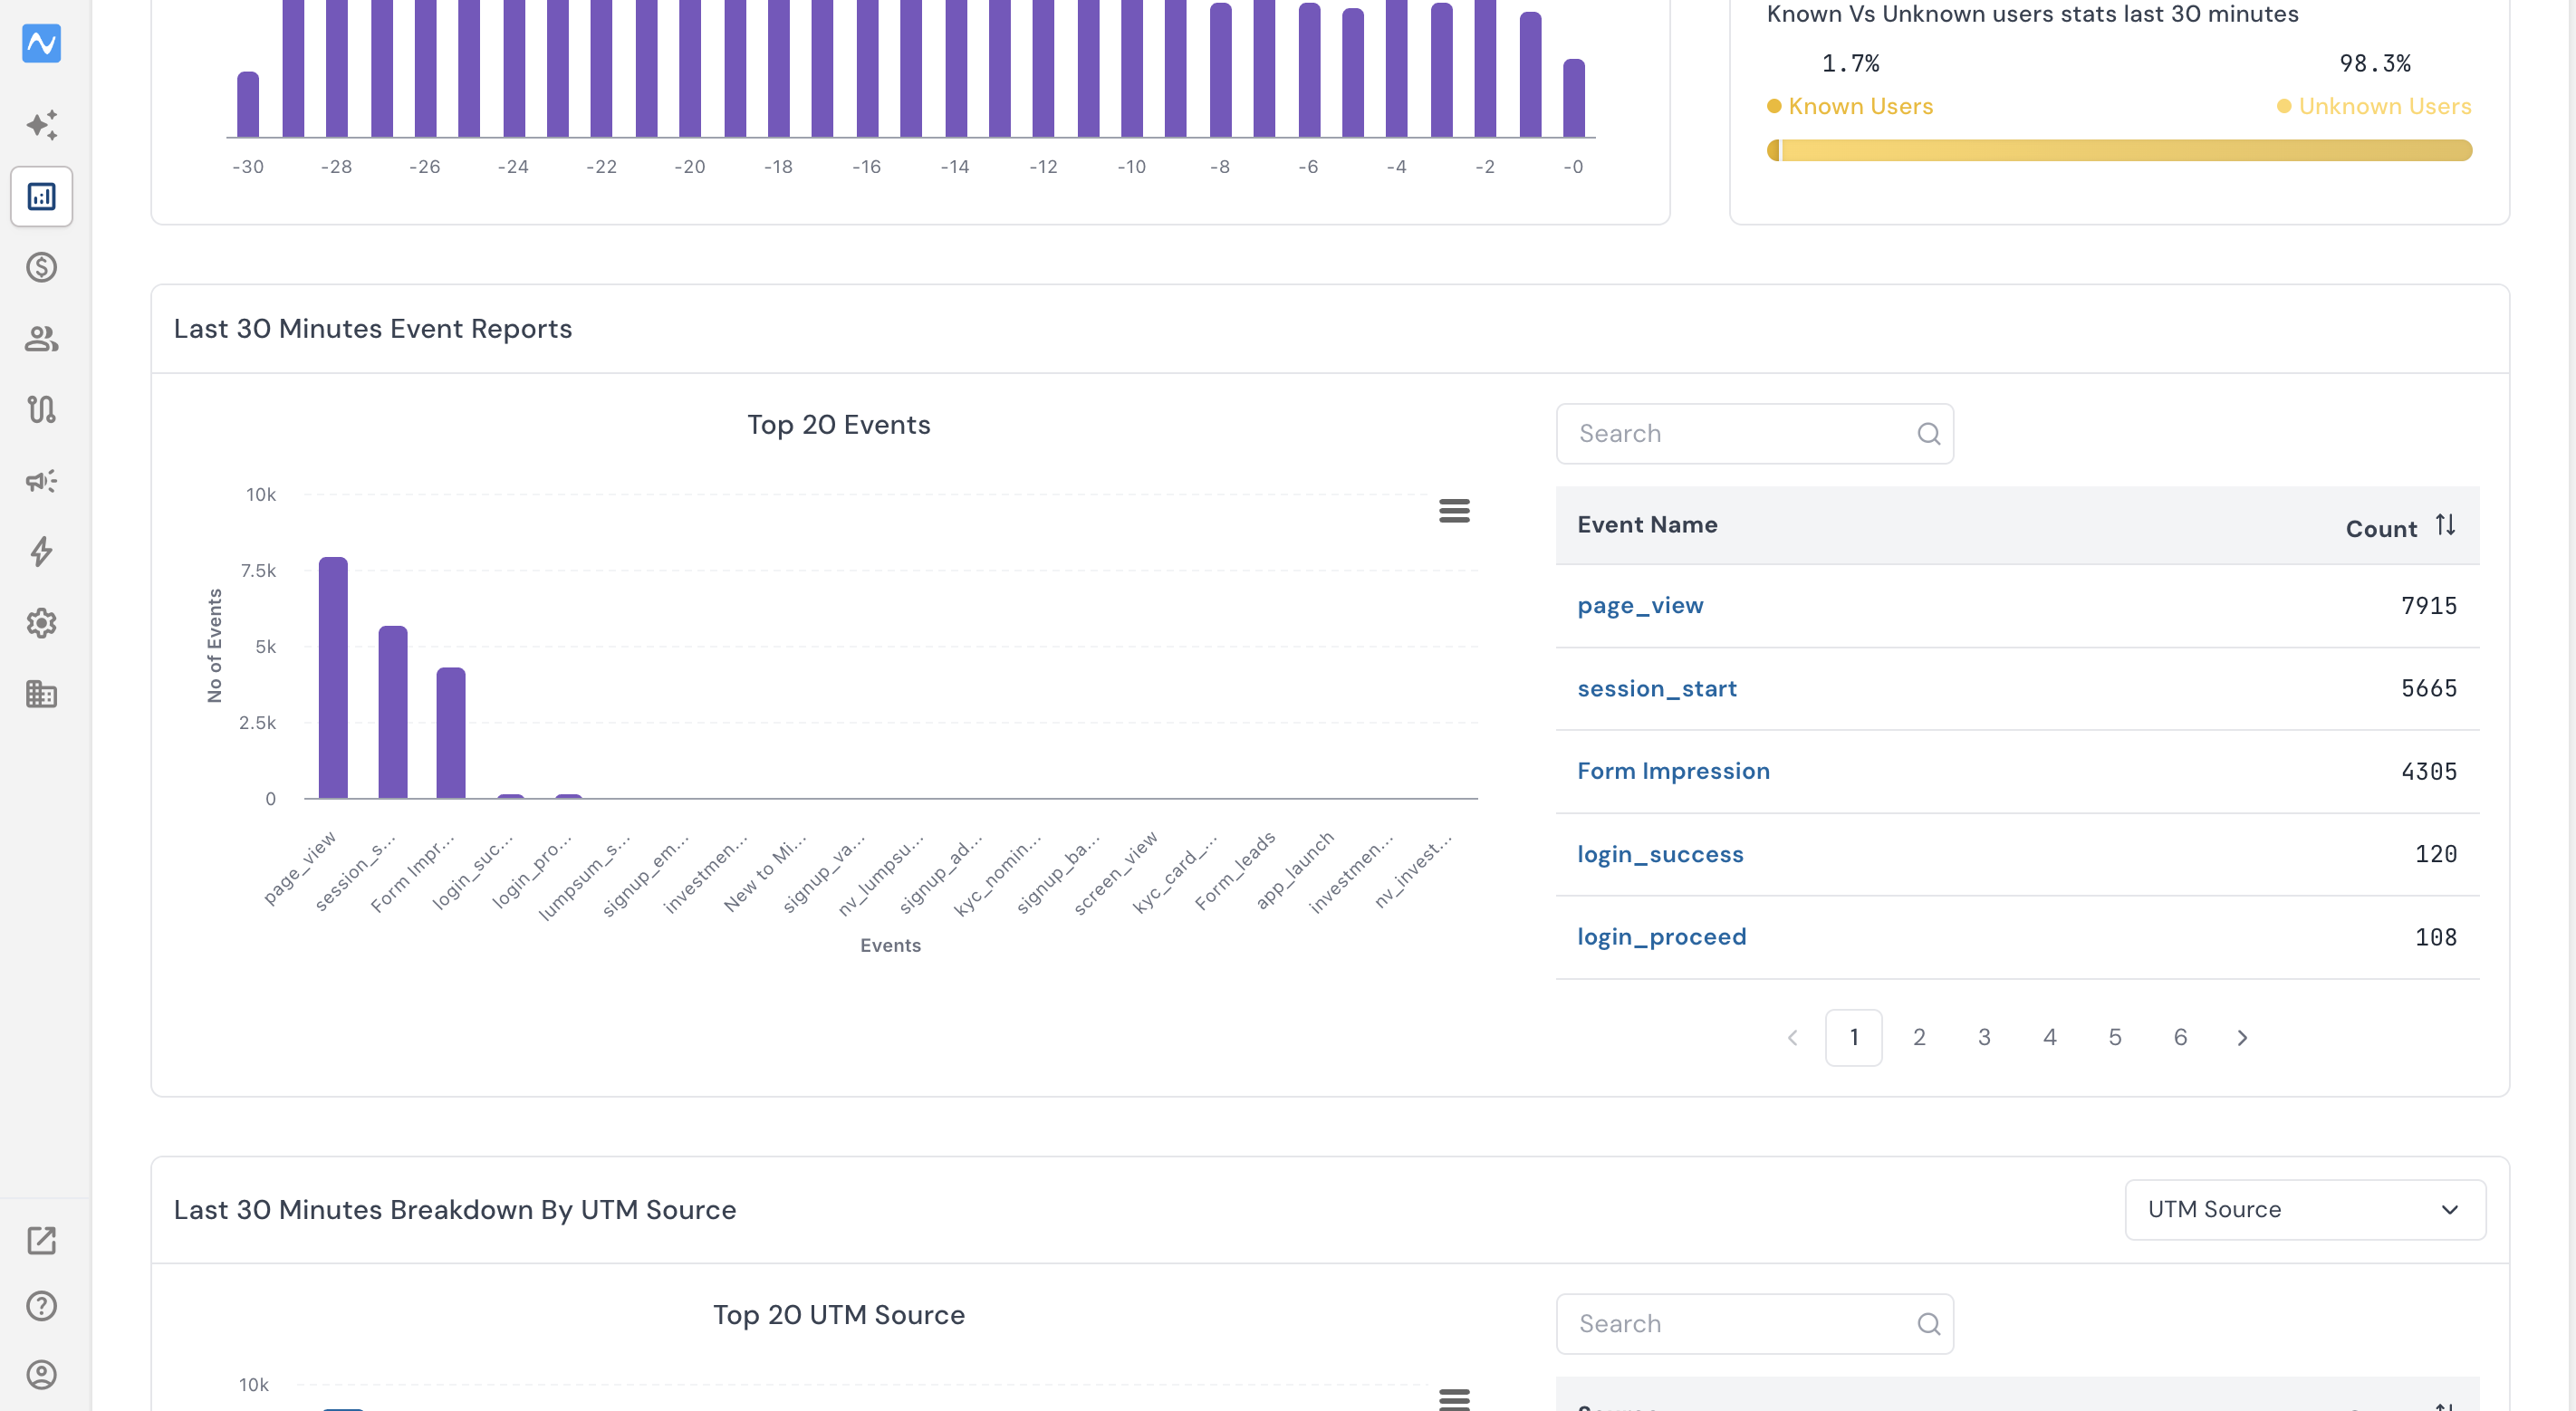
Live Stats shows engagement for the last 30 minutes and refreshes every 30 seconds, so it's the quickest way to confirm an event as it happens.
Where: Analytics → Live Stats
- Perform the action on your site or app.
- Open Live Stats and go to Last 30 Minutes Event Reports.
- Search for your event name in the search box beside the Top 20 Events chart, or find it in the Event Name / Count table.
- If the event appears with a count, it is reaching NVECTA. If it doesn't show up within a minute or two, it isn't being sent.
Live Stats only holds a 30-minute window, so it can't tell you about an event that fired yesterday.
Event Logs (attribute-level detail)
Live Stats confirms an event is firing correctly. To validate the attributes each event is carrying, you can check the event logs within Live Stats.
- In the Event Name / Count table, click the event you want to inspect (e.g. page_view).
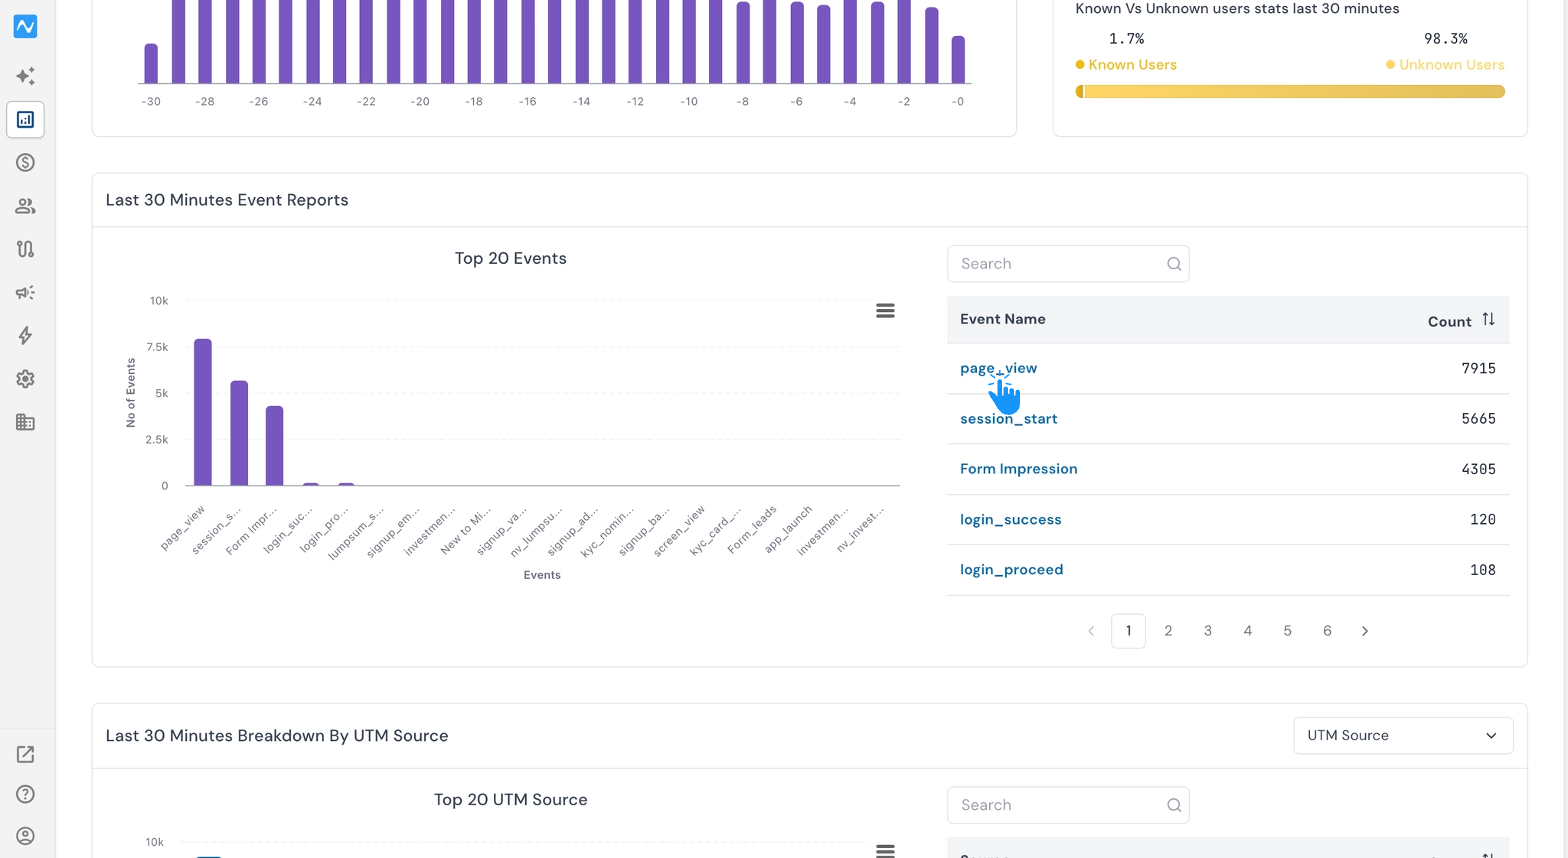
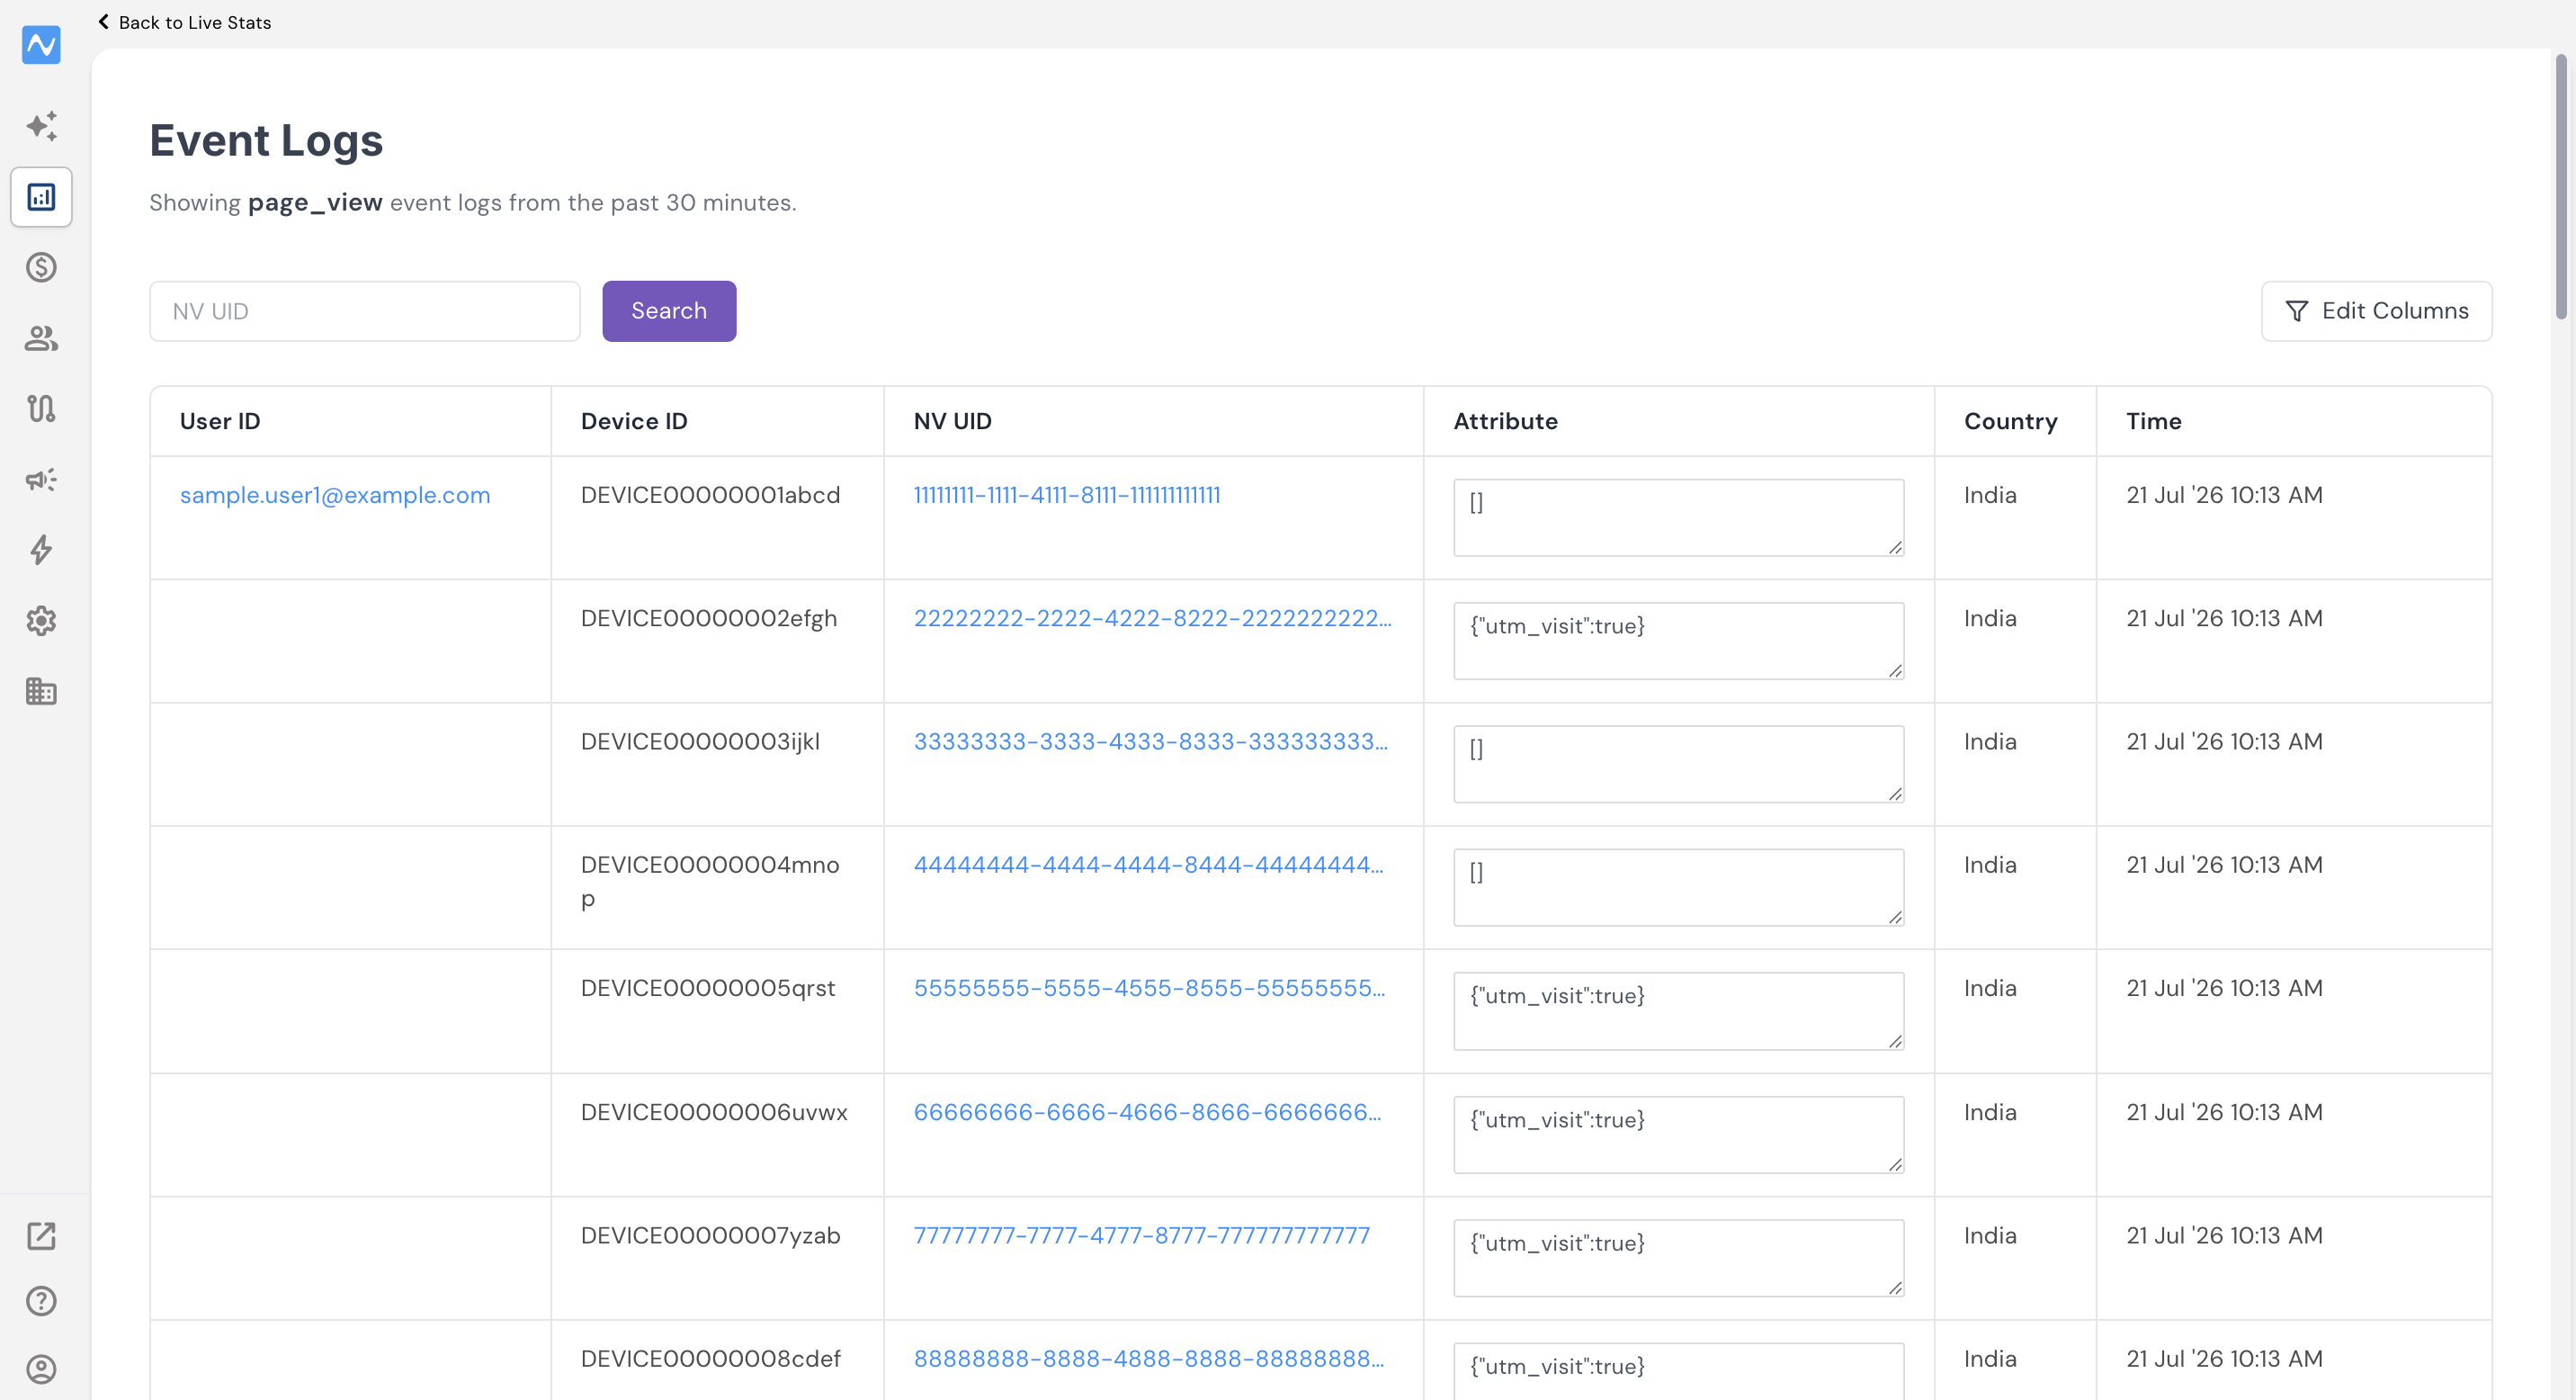
- Event Logs opens, showing individual records for that event from the past 30 minutes — one row per event, with User ID, Device ID, NV UID, Country and Time.
- To check the attributes each event is carrying, click Edit Columns and choose the attributes you want from the Apply Filters panel. They are grouped into Location, UTM, Manual UTM, Ad Params, Device, Platform, App and Traffic — tick the ones you want and click Apply.
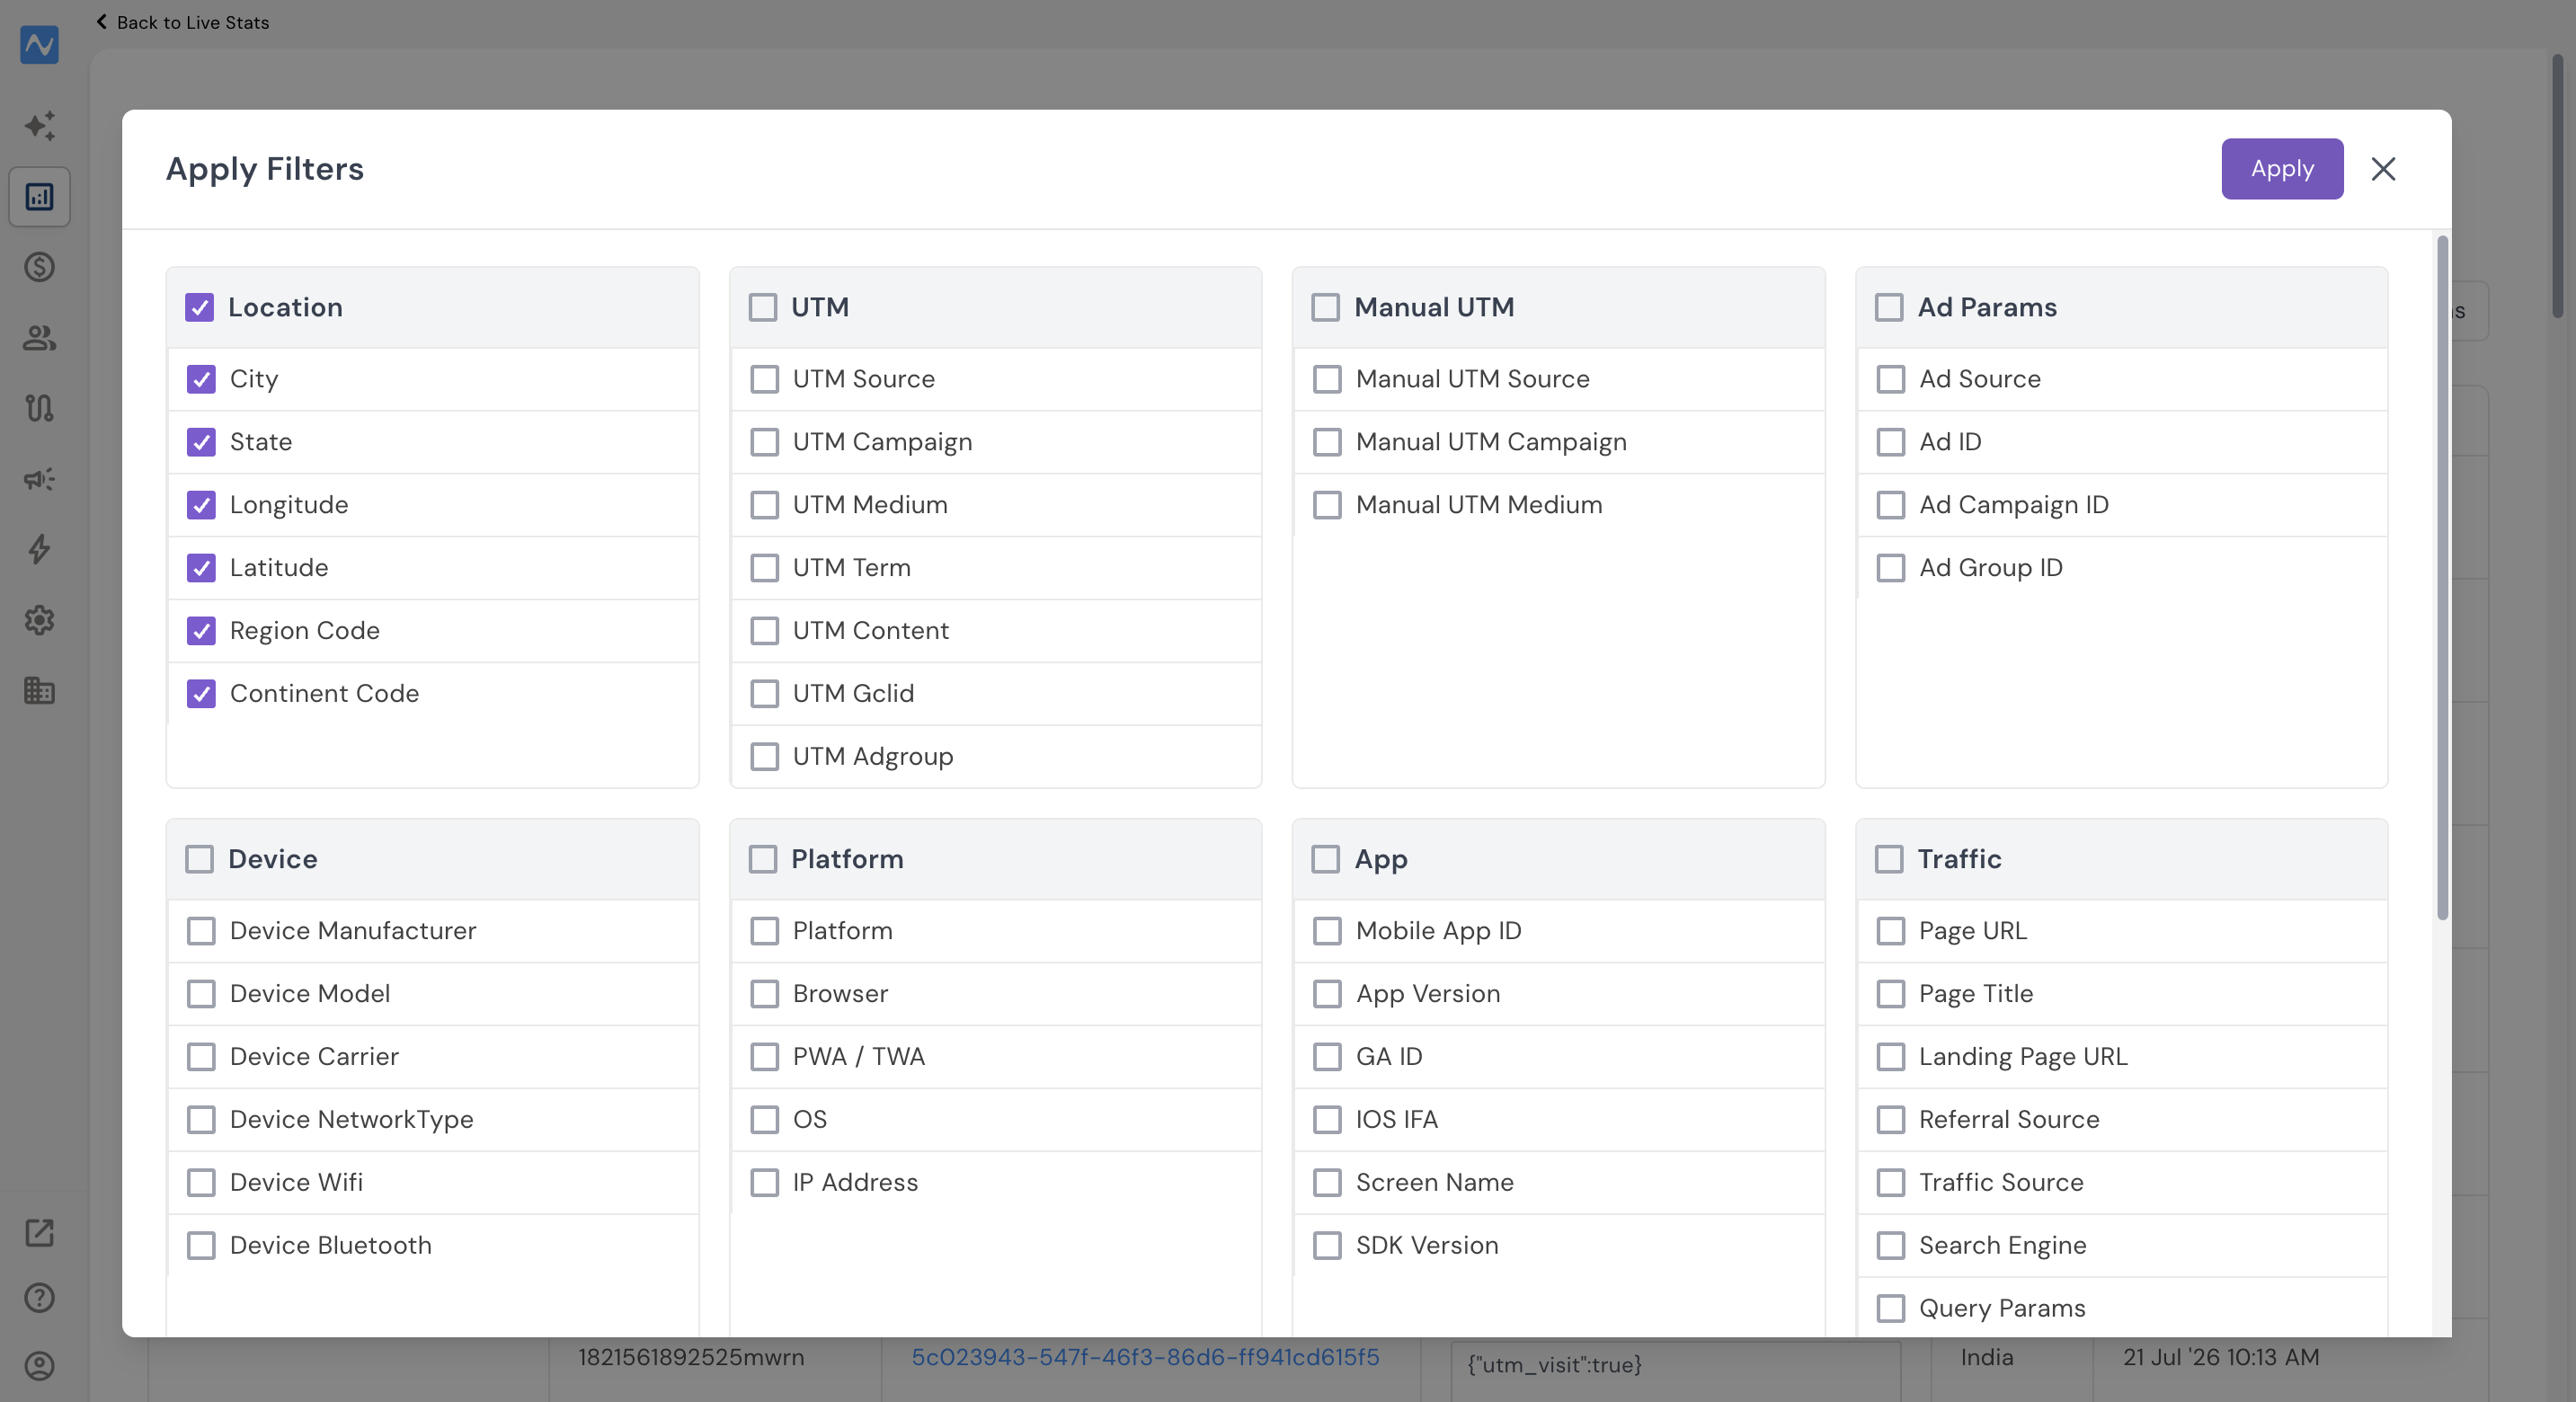
- The selected attributes now appear as columns in the Event Logs table, so you can confirm each event is carrying the values your tracking plan expects. To trace a single user, paste their NV UID into the search box.
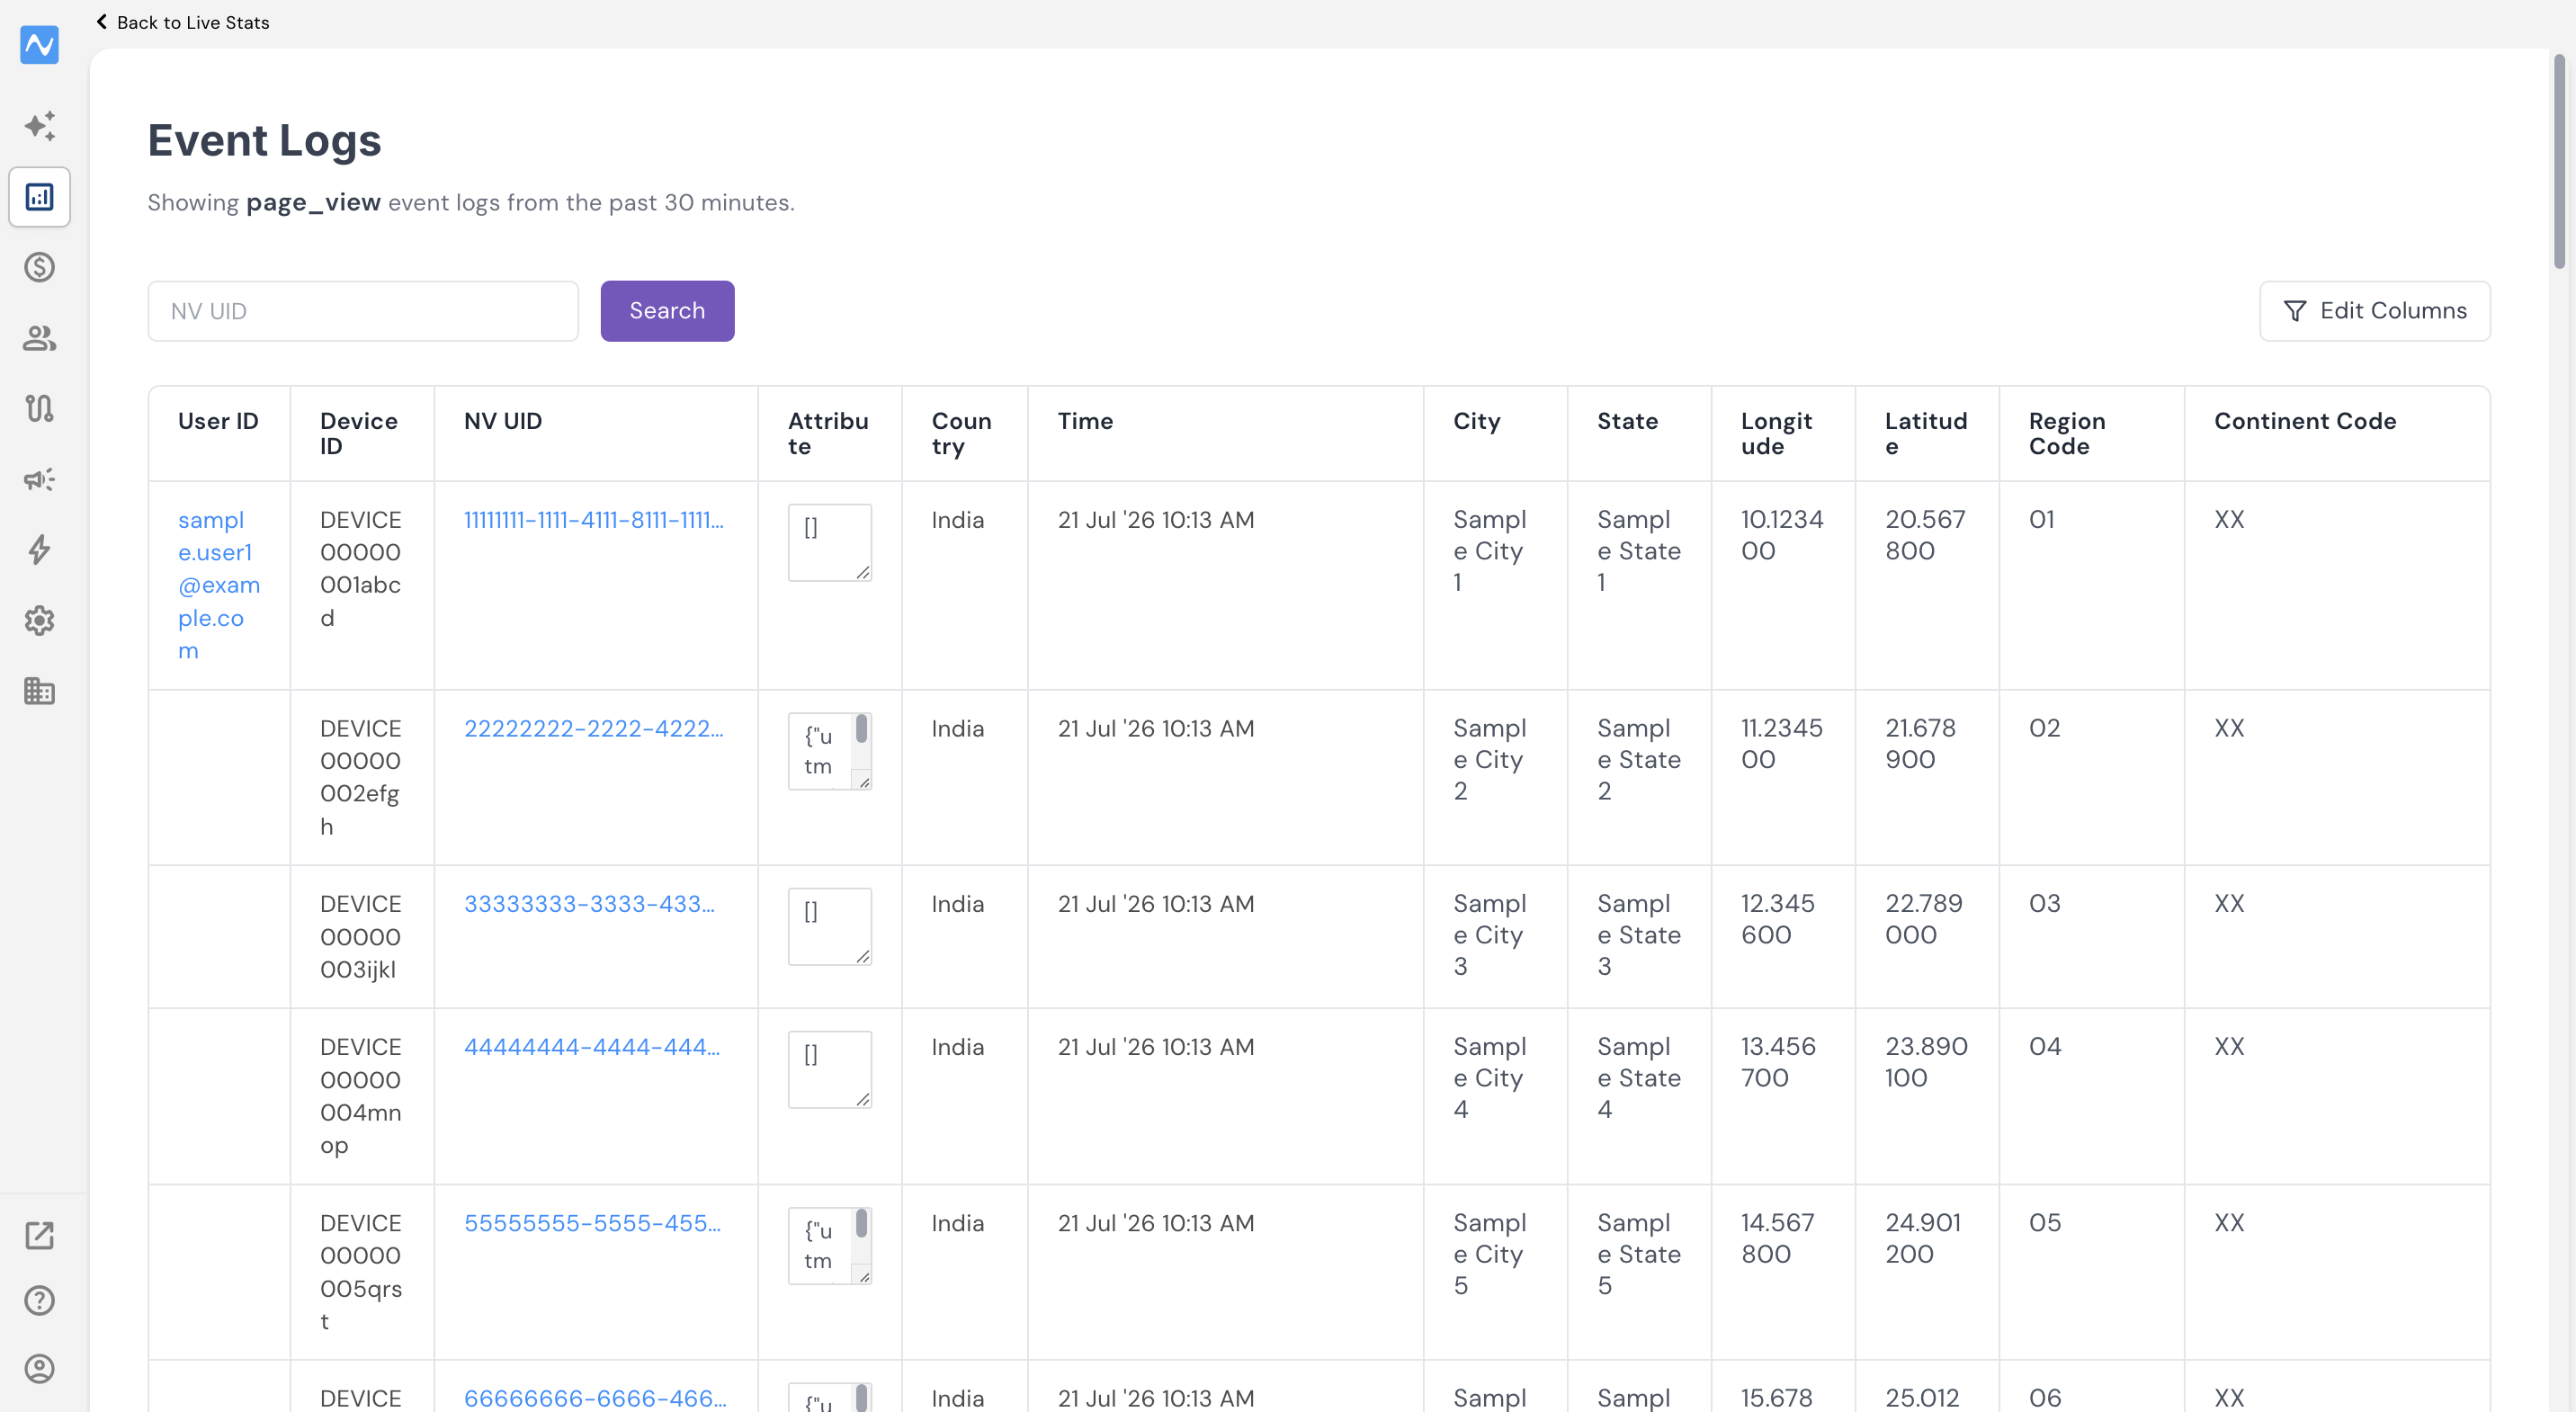
If an attribute you selected shows up empty where you expected data, the property is usually being dropped or misnamed in the event call — check it against your tracking plan.
Insights (historical, with breakdowns)
Insights is where you confirm an event is firing at the right volume, from the right sources, with the right properties, over a real time period.
Where: Reports → Insights
- In the Events panel on the left, click + and add the event/s you want to check.
- Choose Total Events or Unique Users from the dropdown on the event card.
- Pick a date range from the top bar — Yesterday is the usual choice, since it gives you a complete day.
- Read the count in the trend chart/table.
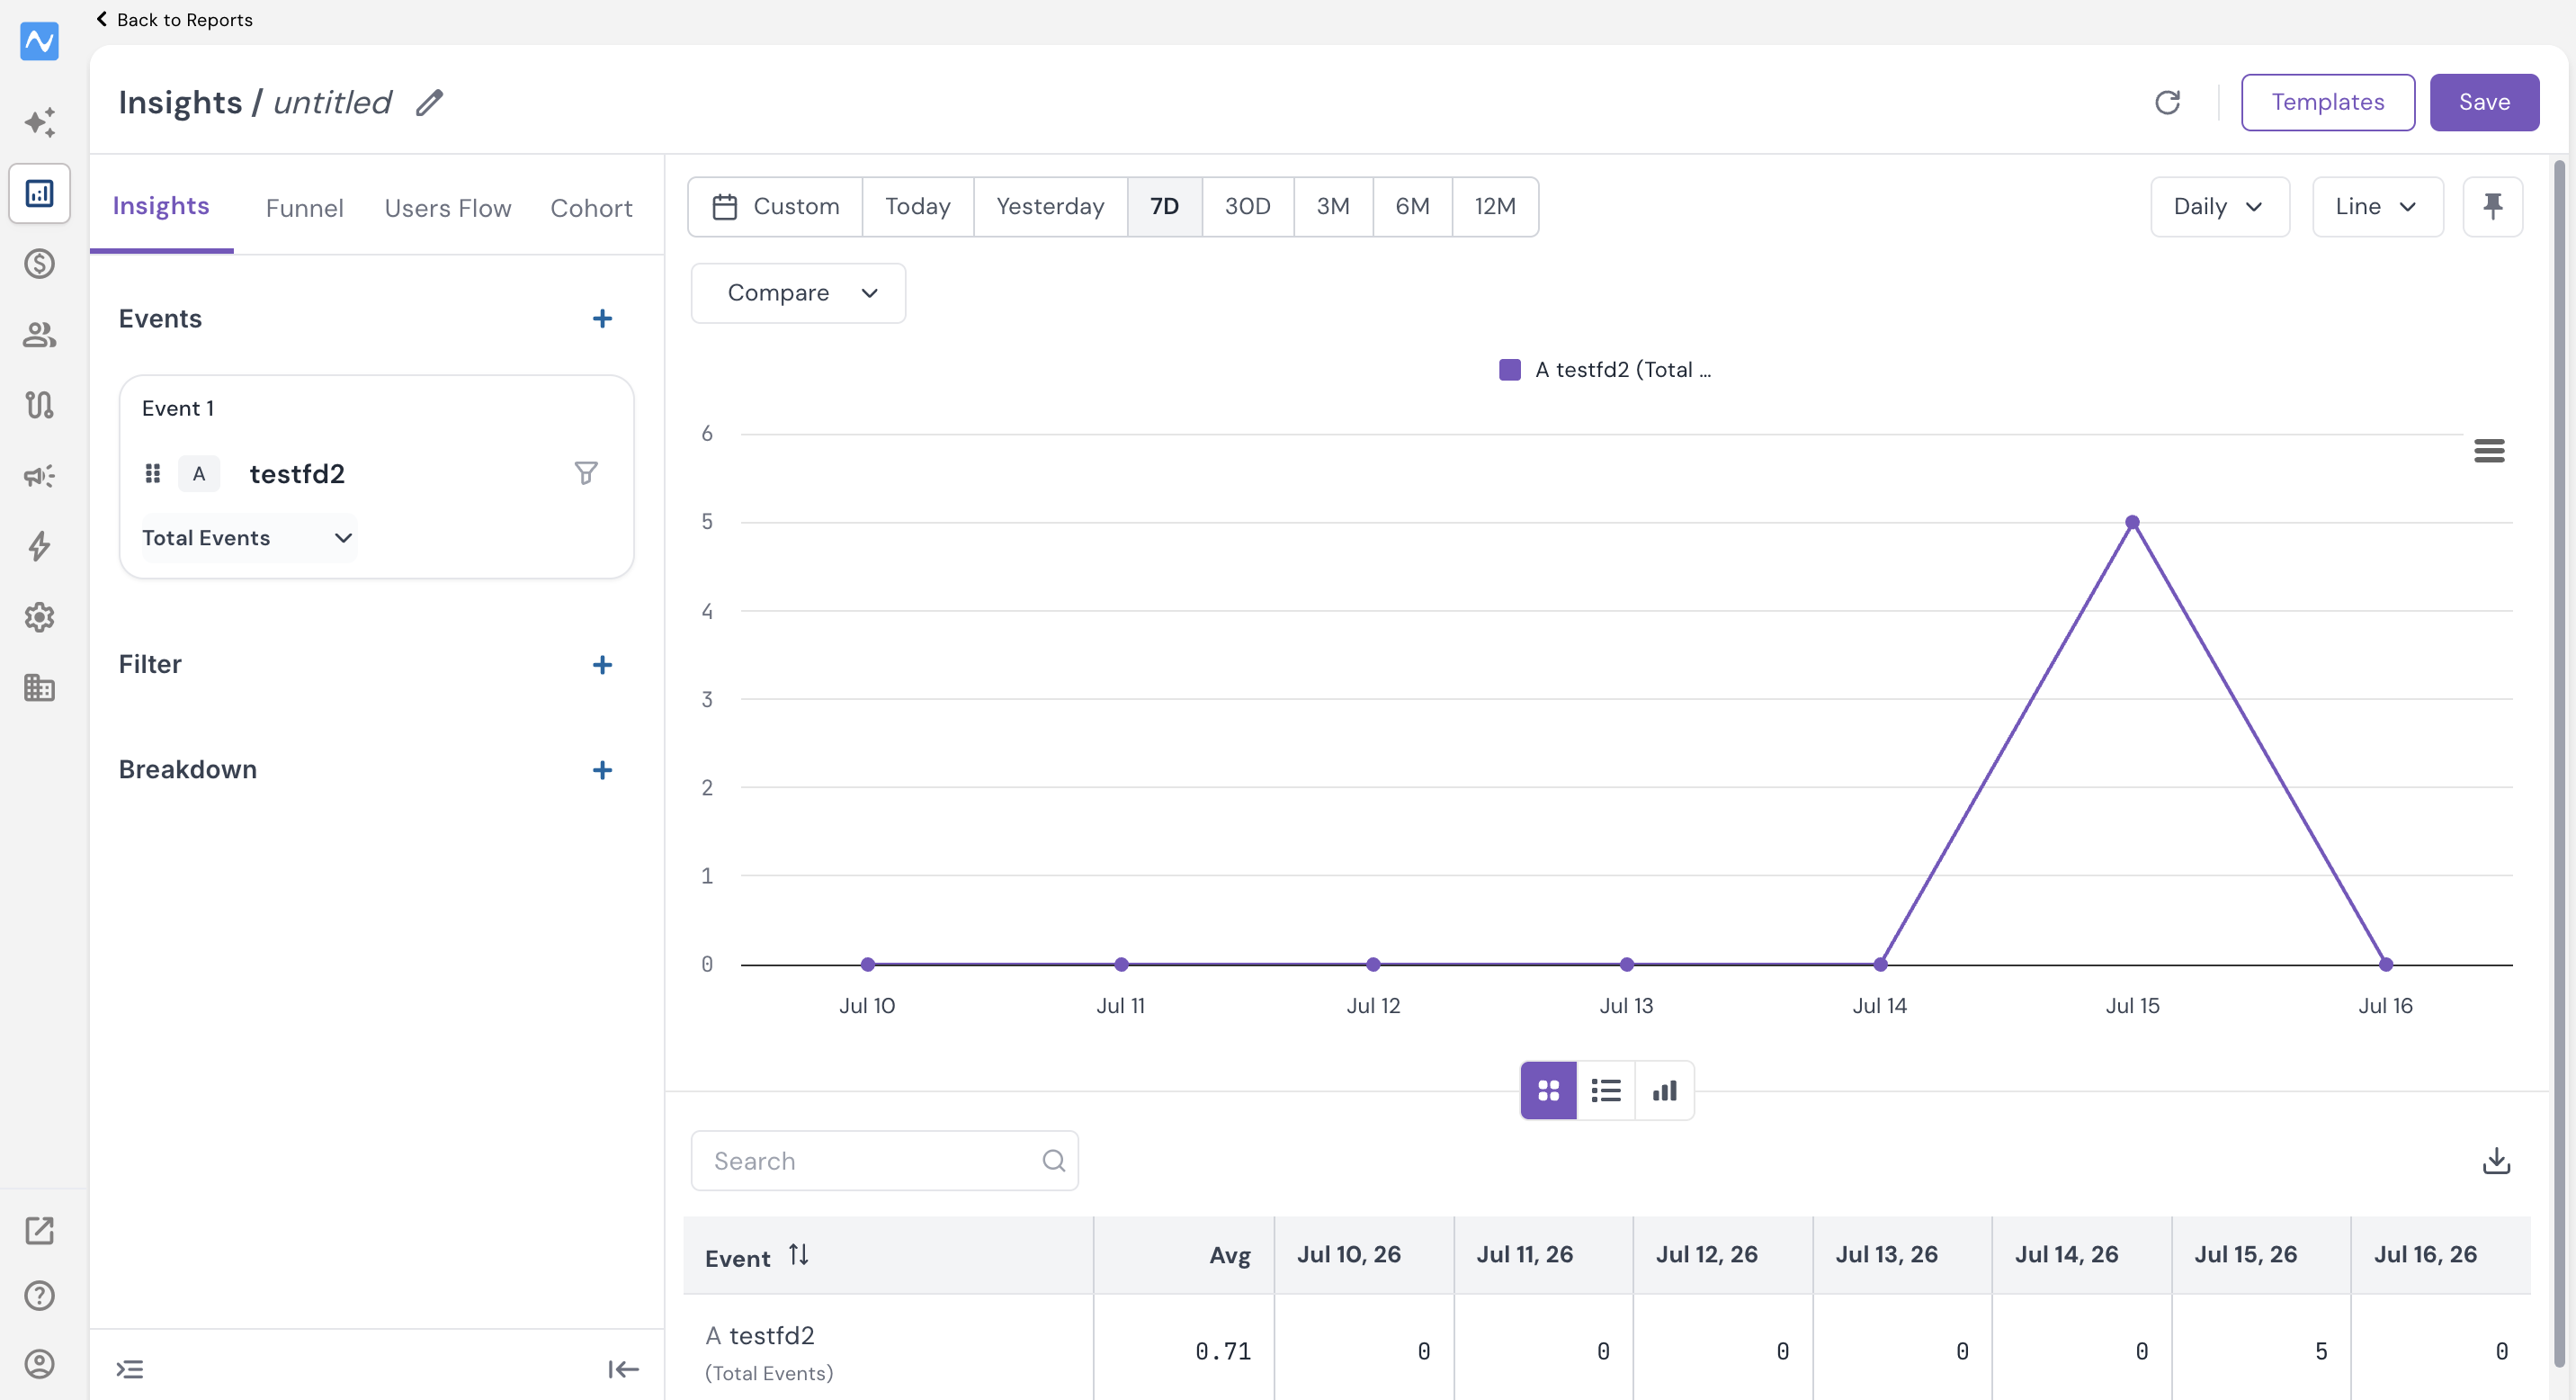
A non-zero count means the event is being tracked. Zero usually means one of two things: the event isn't implemented yet, or the event name in your code doesn't match the name in the panel — check spelling and case first.
Which one to use: Live Stats while the developer is testing — you get an answer in under a minute, and clicking through to Event Logs lets you verify attributes in the same window. Insights for anything older than 30 minutes, and whenever you want volume, breakdowns and trends.
Part 1 — Validate the integration code
The fastest way to confirm an SDK is installed correctly is to look at the system events NVECTA generates on its own. You don't need any custom code for these; if the integration code is in place, they appear by themselves.
Verify session analytics in the panel
Open your dashboard and look at events from the last 24 hours. Check the following:
"Session Start" events
Confirm that the session_start event is appearing for every platform you have integrated:
- session_start for Web
- session_start for iOS
- session_start for Android
- session_start for M-site
If session_start is missing for a platform, the integration code on that platform is either absent, placed incorrectly, or initialised with the wrong brand ID or key. Nothing else will track until this is fixed.
"Page View" events
Optionally, check the page_view event for Web to confirm these events are being captured consistently over the last 24 hours.
"Install" events
Check whether install events have appeared in the last 24 hours. These are usually low in volume, but they should still show up whenever the app is installed during testing.
- install event for Android
- install event for iOS
Low install counts during UAT are normal. Zero installs after your team has installed test builds is not.
If a system event is missing
Before raising an SDK bug, confirm that System Events are enabled. Go to Settings → Events → System Events and check whether session_start, page_view, install, and the other system events are toggled on. Missing system events usually mean they are disabled in this section rather than an SDK issue.
Detailed guide to platform setup: https://www.nvecta.com/docs/nvecta-platform-setup-and-implementation
How to read the result
| What you see | What it means |
|---|---|
| session_start present on all platforms | Integration code is live and reporting |
| session_start missing on one platform | SDK not initialised on that platform, or wrong brand ID/key |
| All system events are missing | System Events may be disabled in Settings → Events |
| session_start present, install missing (apps) | Install attribution or app-level setup needs a look, session tracking is fine |
Part 2 — Validate a specific event
System events tell you the SDK works. They don't tell you whether your custom event is firing the way your tracking plan says it should.
Go back to Live Stats and Insights and repeat the same steps, this time searching for the event names in your tracking plan instead of session_start, page_view and install. In Insights, you can add multiple events at once to check them all in one view.
The difference is what a zero means. A missing system event usually points at the SDK or the System Events toggle. A missing custom event points at the event call itself — either it hasn't been implemented, or the name in the code doesn't match the name in the panel.
To confirm the event is carrying the right properties and not just firing, open its Event Logs from Live Stats (see above) and read the Attribute column against your tracking plan.
Conclusion
These two checks close the loop in your implementation. System events appearing across Web, M-site, Android and iOS confirm the integration code is live. Custom events showing counts in Live Stats and Insights confirm your tracking plan is actually implemented and not just documented, and Event Logs confirms each event is carrying the attributes it should.
Run the full pass in UAT first, fix whatever is missing, then repeat the same checks in Production before you start relying on the data. It's also worth re-running the pass after any release that touches the site or app — a broken event is far cheaper to catch on the day it breaks than a month later, when your segments and campaigns have been quietly built on incomplete data.
Was this article helpful?
That’s Great!
Thank you for your feedback
Sorry! We couldn't be helpful
Thank you for your feedback
Feedback sent
We appreciate your effort and will try to fix the article